a good morning for more thermal imaging

Front 2 Jan 2015

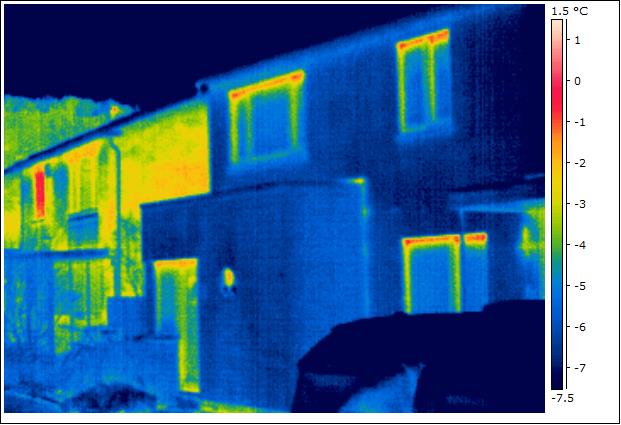
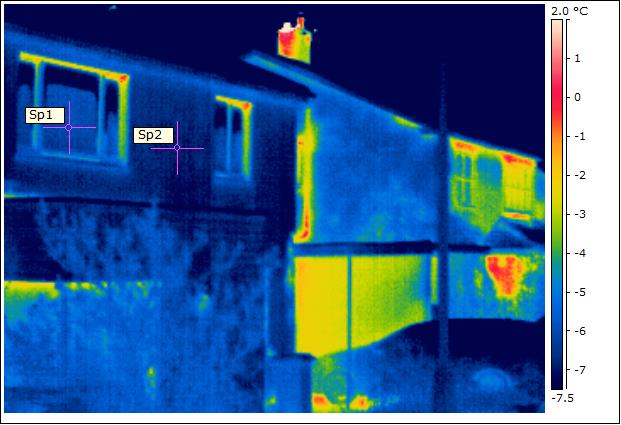
Perfect conditions this morning for some more thermal images. The house is still performing well, and as these images show, there is quite a contrasting heat loss between us and neighbouring properties (which have cavity wall insulation). The temperatures across the front elevation show good uniformity, and the triple-glazed windows are approximately the same temperature at centre pane point (spot temperatures on image below: Sp1 = minus 6.5°C and Sp2 = minus 6.2°C). As highlighted in the the posting for last year’s survey, there is some thermal bridging around the top of the windows, but budget restrictions meant that we didn’t invest in the best thermal performers. Still quite pleased with with their overall performance.

Front 1 Jan 2015

It’s not all good news however. Around the back, some problems are coming to light (in the IR spectrum). This is where the first lot of external wall insulation was applied, and it looks like we have some thermal bypass – possibly air gaps beneath the first insulation layer.

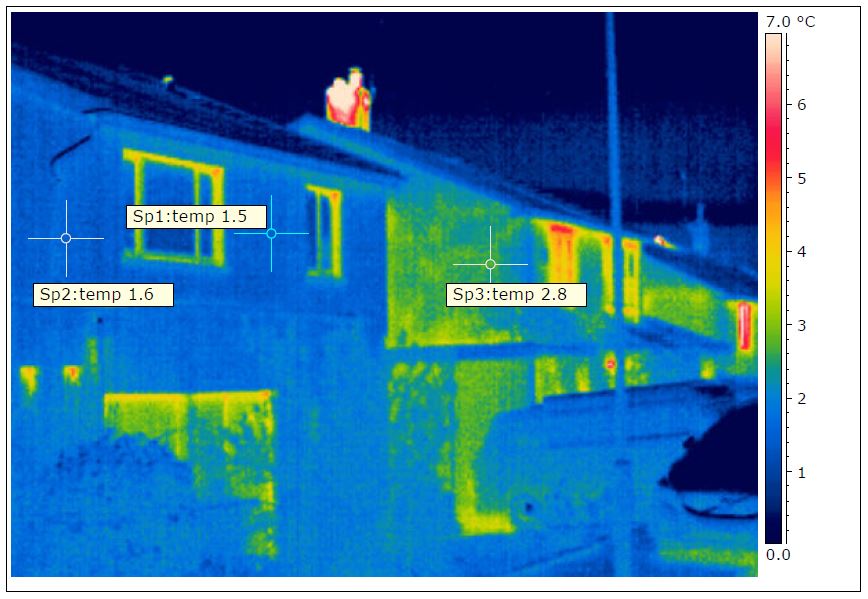
Temperatures on the spots below are: Sp1 = minus 5.0°C, Sp2 = minus 2.1°C, Sp3 – minus 2.8°CRear Flank Wall

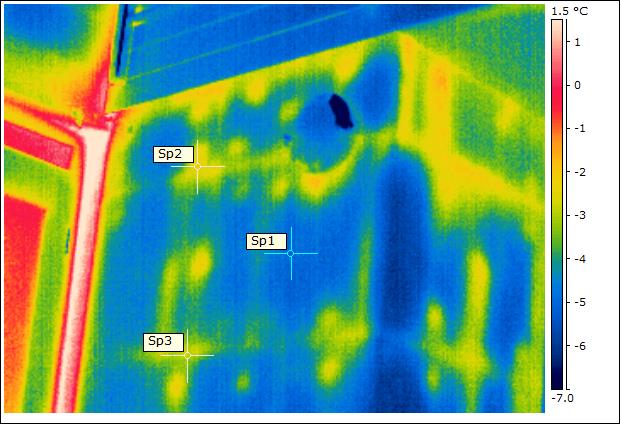
Temperatures on the spots below are: Sp1 = minus 5.0°C, Sp2 = minus 3.4°C, Sp3 – minus 2.0°C, Sp4 = minus 2.7°C, Sp5 = minus 5.0°CRear Flank Wall Low

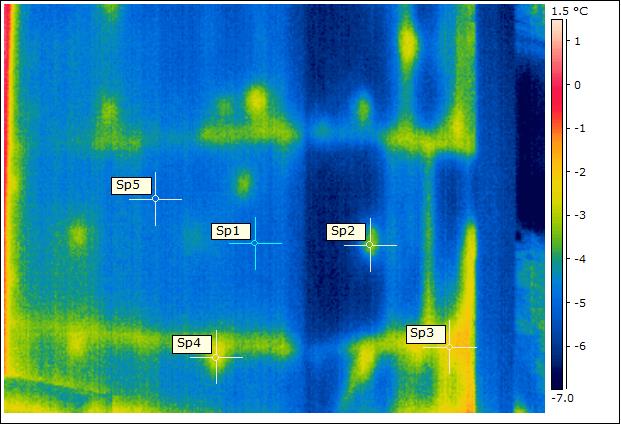
There’s not a lot we can do about this, unless a problem arises in the future. The internal scan showed good uniformity, and checks with a moisture meter do not suggest anything sinister. Not sure why this didn’t show up on last years survey – perhaps some de-lamination has occurred over the last year? It was the wettest point, I recall, so may be the adhesive has de-bonded – this is why mechanical fixings are also required. I will, at some point, do in-situ U-value measurements. If I apply heat flux plates around here then I can compare with a ‘good’ section and see what the difference is. When I know more, I’ll post. As always, I welcome comments.

fabric performance – thermography

front LHS2 IR

The fist thermal images of the finished house were taken very early in the morning at the end of January. The results are very encouraging and show, as expected, that the insulation measures are working well, and that we have significantly reduced the amount of thermal bridges, particularly for the concrete gutters. The image above shows our house in the foreground with our neighbours’ houses beyond. The temperatures of the outside of our house are the same as unheated surroundings: vehicles, plants, etc. Compared to neighbouring houses, not only are the surfaces cooler (less heat escaping), but the temperatures are more uniform, showing good insulation continuity.

front LHS IR

The image above was taken further up the street, with our house now in the background. Our neighbour’s house in the foreground has the same thermal properties as our house did when we moved in, i.e. no cavity wall insulation. The difference is quite striking between our properties.

rear IR

From the rear, the house appears to be performing well too. The wall insulation is continuous and the thermal bridging relating to the concrete gutters (as shown in an earlier post) have been eliminated. There is a small amount of thermal bridging around the new window frames, but this is expected given that we opted for less expensive windows that do not have thermal breaks in the core of the frame.

rear neighbour IR

By contrast, our neighbour’s house is losing more heat, as shown in the image above. The thermal bridges from the concrete gutters and the single leaf masonry panel beneath the windows are quite evident.

wemico trays

We have introduced some bridges that we hadn’t thought about. Ironically, it is from the steel trays that carry the external wall insulation panels that are conducting heat. These are fixed to the masonry (warm side of the insulation) and some of this heat is clearly coming through. Perhaps plastic trays would have been better. In the grand scheme of things, this is relatively minor stuff.

week 22: early results on cavity wall insulation

December (Pre- Cavity Wall Insulation)  January (Post Cavity Wall Insulation)

At the beginning of December, not long before the cavity wall insulation was injected, I took the opportunity to take some thermal images of the house. As the image above left shows, we had a significant amount of heat loss through the cavity. Warm air (shown yellow/ green) was entering the cavity and escaping at high level.

I carried out another survey earlier this week (cavity wall insulation has now been injected – see earlier post). The image above right shows the same north gable wall. There are no yellow/green areas at all, which suggests that the cavity fill has significantly reduced the air movement within the cavity. This is the primary purpose for the cavity fill, otherwise the external wall insulation (to be fitted shortly) will be less effective.

The area highlighted by a red arrow indicates an area of higher heat loss at the front of the house (you may need to click on the image to enlarge it). This area is a small solid wall section and again illustrates the the effectiveness of the cavity wall insulation elsewhere. More images to analyse and post later.

One final thing for now on cavity wall… we had the opportunity to look into the cavity again as we are changing the aperture of one of the windows. The ecobead insulation again beats my expectations and has completely filled the entire cavity:

Existing kitchen window

heat storage

The two thermal images above were taken last week. The image on the left was taken at about 8am on the morning after we had the wood burner on. The one on the right was taken 4hrs later, around midday. With the stove cold (as shown by dark blue/black colours), it is quite striking how much heat is stored in the chimney, which is releasing this beneficial heat into the living room. Continue reading