The sub-meters that were installed (see earlier post) have been sending data every 5 minutes to the data logger for the last 18 months. Regular analysis of this energy data has allowed us to start optimising our energy use. The chart below shows the recorded energy use for each electrical circuit (click for enlargement).
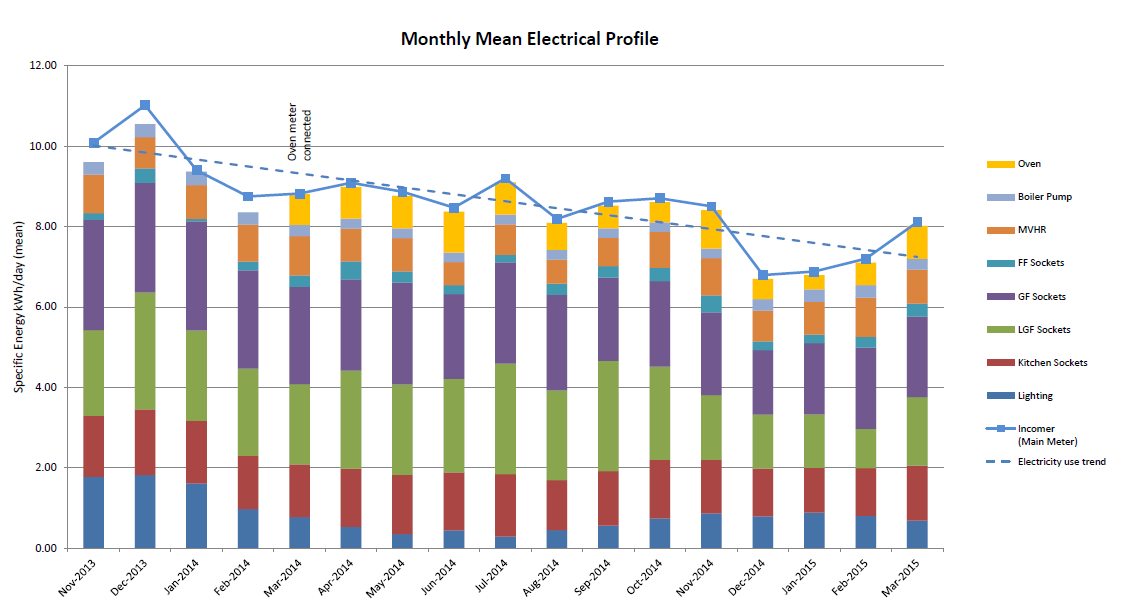
The green coloured stacks show the lower ground floor socket circuit, and purple is for the ground floor sockets. These two circuits were responsible for over half our annual electrical use (2014). Given that we operate two separate businesses from home, the ground floor circuit (mostly IT and electronics) did not ring too many alarm bells at first. However, there is room for some efficiency here – additional plug-in meters for individual equipment have been fitted, and results from this investigation will be posted shortly. A closer look at the lower ground floor showed that a fridge freezer (which we inherited with the house) was responsible for nearly 60% of the consumption of that circuit (15% of total electricity). We made a decision in October 2014 to retire the old fridge and replaced it with a new efficient A+ model. Whilst it has made a significant improvement, in hindsight, we should have gone for an A+++ model. Although an extra £150 to buy, the payback from additional energy saved would have been a similar 7-8 years as with the A+ model. But then A+++ model availability is fairly limited right now, and A++ unit payback (similar purchase price to A+++ but greater model choices) wasn’t worth it in payback terms (9-10 years).
The blue colour on the chart shows the lighting energy use, which varies as expected across the seasons. However, November 2013 to February 2014 showed a higher than expected energy use for lighting, so some changes were made: changing over a couple of regular-use lamps to LEDs, and being more economical with use. The reduction in energy use 12 months on (November 2014 to February 2015) is fairly evident – approximately half the amount of energy used. Except for the MVHR circuit, the remaining circuits are limited in their ability to be further optimised. The MVHR unit used a total of 290 kWh in 2014, which is within expectations. It has just been re-commissioned, which resulted in some fan speed adjustments to slightly lower settings, but this summer we may also look to switch it off for some periods when windows are open.
The dotted blue line shows the total electrical energy use trend over this period. We are on a downward trajectory, which is good. Our total electricity for 2014 was 3240 kWh – a 21% reduction compared to pre-retrofit use of 4120 kWh (nearer to the UK average household for 2013 of 4170 kWh¹). The aim is to get the annual consumption comfortably below 3000 kWh – a further 10-20%, which looks to be achievable.