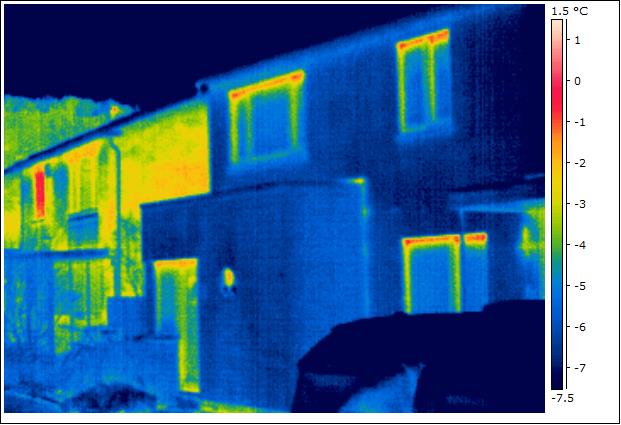
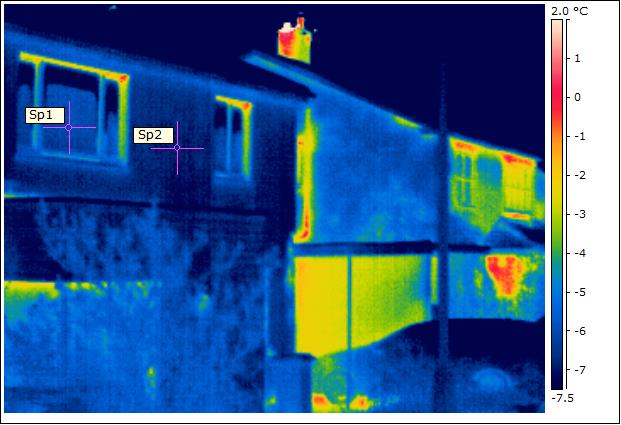
Perfect conditions this morning for some more thermal images. The house is still performing well, and as these images show, there is quite a contrasting heat loss between us and neighbouring properties (which have cavity wall insulation). The temperatures across the front elevation show good uniformity, and the triple-glazed windows are approximately the same temperature at centre pane point (spot temperatures on image below: Sp1 = minus 6.5°C and Sp2 = minus 6.2°C). As highlighted in the the posting for last year’s survey, there is some thermal bridging around the top of the windows, but budget restrictions meant that we didn’t invest in the best thermal performers. Still quite pleased with with their overall performance.
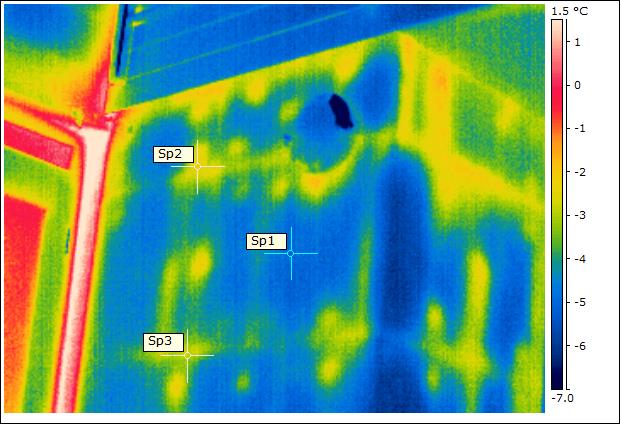
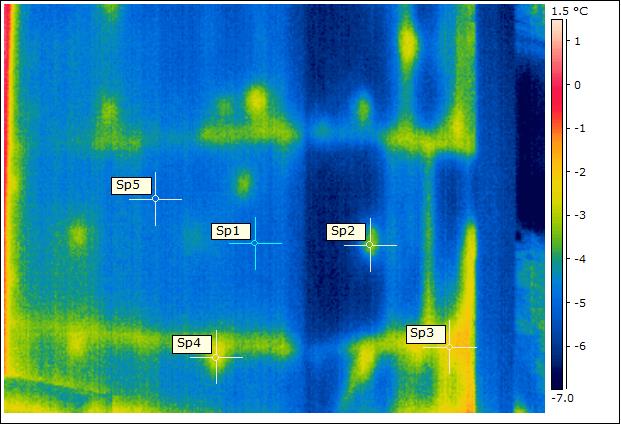
It’s not all good news however. Around the back, some problems are coming to light (in the IR spectrum). This is where the first lot of external wall insulation was applied, and it looks like we have some thermal bypass – possibly air gaps beneath the first insulation layer.
Temperatures on the spots below are: Sp1 = minus 5.0°C, Sp2 = minus 2.1°C, Sp3 – minus 2.8°C
Temperatures on the spots below are: Sp1 = minus 5.0°C, Sp2 = minus 3.4°C, Sp3 – minus 2.0°C, Sp4 = minus 2.7°C, Sp5 = minus 5.0°C
There’s not a lot we can do about this, unless a problem arises in the future. The internal scan showed good uniformity, and checks with a moisture meter do not suggest anything sinister. Not sure why this didn’t show up on last years survey – perhaps some de-lamination has occurred over the last year? It was the wettest point, I recall, so may be the adhesive has de-bonded – this is why mechanical fixings are also required. I will, at some point, do in-situ U-value measurements. If I apply heat flux plates around here then I can compare with a ‘good’ section and see what the difference is. When I know more, I’ll post. As always, I welcome comments.


