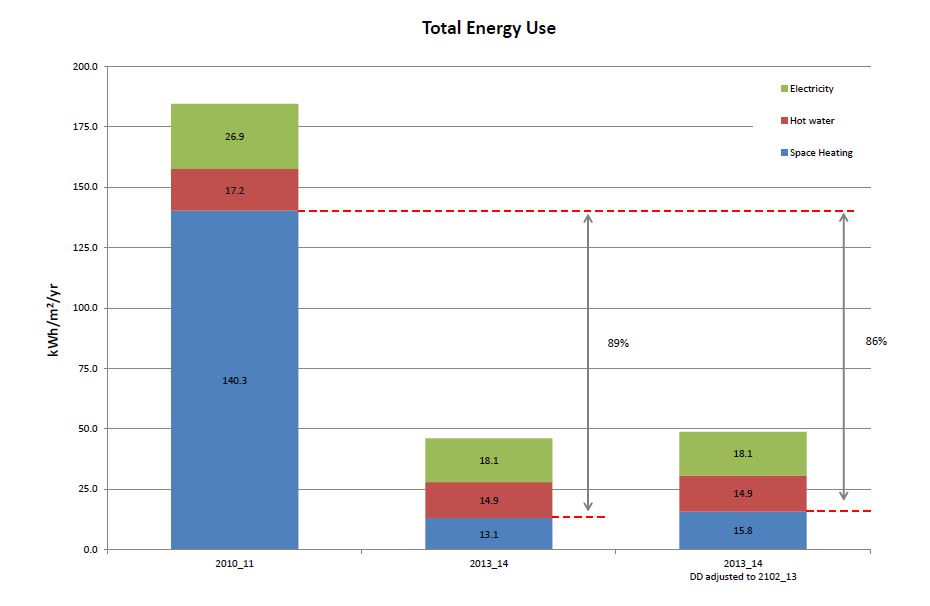
The chart shows a summary of our measured energy use over the last 12 months for gas and electricity, compared to energy the first (base) year that we were here, which spanned a cold winter (2010_11). Over this period we used a huge amount of gas: 24,367 kWh (typical consumption for an older home is 20,500 kWh/annum¹). The split between heating and hot water was estimated² as 89% and 11% of total gas use respectively, and equates to a specific heating consumption of 140.3 kWh/m²/yr. The comfort in the house was poor that winter and the old heating system really struggled to keep the house warm.
Now fast forward to the last winter 2013_14³, which was comparatively mild, but the reduction in space heating and total gas use is quite striking. Total gas use has reduced by almost 80% compared to the base year, and space heating has reduced by almost 90%. Total gas consumption was 5300 kWh for the year, with proportions being 47% for space heating, 47% for hot water and 6% for new gas hob. The specific heating energy for the last year was 13.1 kWh/m²/yr, which comes in a touch below the Passivhaus target of 15 kWh/m²/yr.
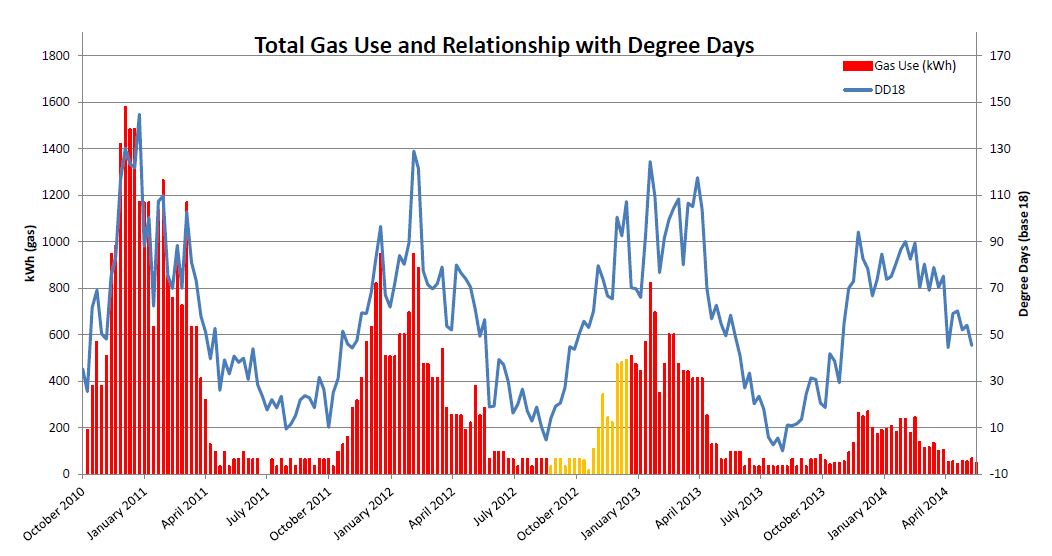
The chart above shows the weekly gas meter readings (total gas) with the degree days overlaid (blue line). Put simply, heating degree days give an estimate of the amount of heating energy, calculated using local, historic weather data. The chart shows a very close fit between the degree days and heating energy use for the first winter (left side of chart). Moving toward the right shows how the gas has progressively reduced (note yellow areas denote when gas was decommissioned during construction: meter reading substituted for electrical heater meter readings). Most striking is the comparison between the last winter of 2013_14 to the winter of 2010_11.
In acknowledgement that it was an unusually mild winter, I have carried out a degree day assessment to determine the amount of heating that would have been required in a cold winter (using the long, cold winter of 2012_13 for the assessment comparison). The results of the assessment for this region, estimate that 21% more heating energy would have been required. This would increase our specific heat demand by 2.7 kWh/m²/yr, to 15.8 kWh/m²/yr – refer back to the right-hand column on the top chart ‘2013_14 DD adjusted’. This revised value is a little above the maximum for a Passivhaus, but is much lower that the maximum allowed for a Passivhaus retrofit (EnerPHit), which is 25 kWh/m²/yr.
There is still a little more thermal work to do beneath the house (insulation and airtightness), so hopefully we will continue to make reductions. But we are very pleased with the results so far. Or, as one of our neighbour’s put it: ‘snug and smug’!
Electrical energy has reduced by 17% compared to the first year, although we still have some further efficiencies to make. All lighting is now either LED (approx 50%), or a mix of compact and linear fluorescent, which is the main measure so far. But, we added an MVHR ventilation system as part of the retrofit, so a 17% overall reduction is not too bad right now.
More details will become available shortly, particularly for electrical energy use, which is fully sub-metered. At some point I hope to be able to do some in-depth analysis on the gas use to measure, rather than estimate, the proportions for heating, hot water and cooking. But, with an annual gas bill of C.£200, it is difficult to justify spending the best part of £1000 to buy and fit the monitoring kit and pulsed meters to do this.


