This first article on the topic of IAQ reports on the results from enhanced monitoring and air sampling, which took place during the winter (2015/16) to evaluate the levels of volatile organic compound (VOCs) pollutants inside the home, and the potential increase of these pollutants when the ventilation rate was reduced.
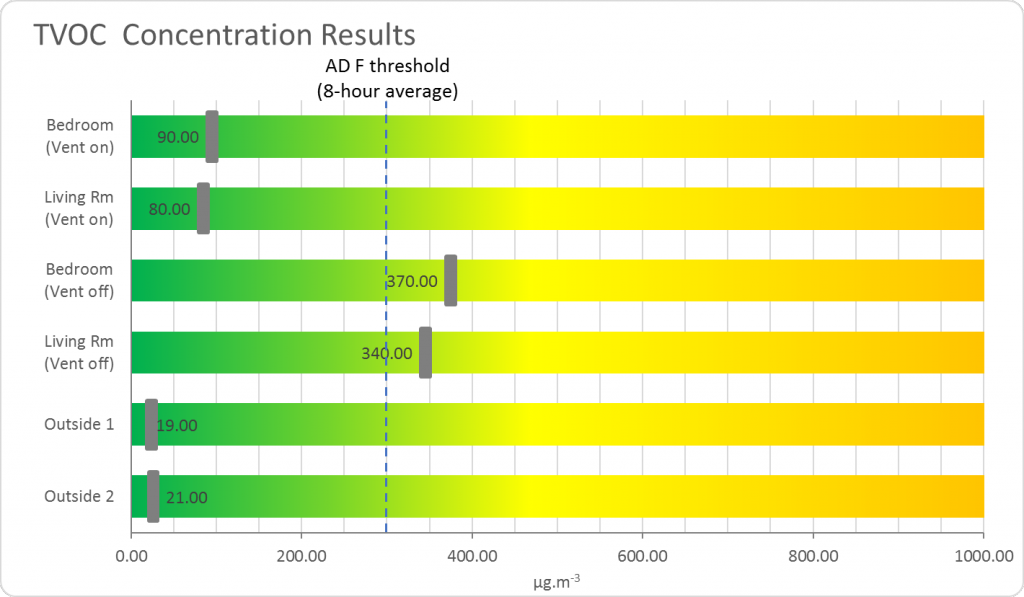
The chart shows the results of samples taken from the main bedroom and living room over two 7-day periods. The first set of samples were taken with the MVHR ventilation running continuously (i.e. as normal) delivering 220 m³/hour (approximately 0.5 air changes). The second set of samples were taken with the ventilation set to unoccupied mode, which delivers 140 m³/hour for 15 minutes in every hour (less than 0.1 air changes) – show as ‘ventilation off’ on the chart. Activities and occupancy were similar, and there was a two-week interval between the samples being taken.
According to the performance criteria in Approved Document F, exposure to TVOCs should not exceed 300 μg/m³ averaged over an 8-hour period. It is clearly evident that, whilst the ventilation is running normally, both the living room and main bedroom fall well within this threshold value, measuring 80 and 90 μg/m³ respectively, averaged over the 7-days. However, the repeat measurement with the reduced ventilation rate shows and increase to 340 and 370 μg/m³ receptively for these rooms – an increase of around 75%. The ventilation rate was reduced at the beginning of the sampling, so the observed concentration would likely be higher still if the sampling commenced at a later point.
Whilst TVOCs do not give an indication of the ‘toxicity’ of the air, analysis of the chromatograms identified chemicals, which included: 2-chloropropane – a chemical used as a blowing agent in some phenolic insulants; α-pinene and 3-carene – naturally occurring, derived from oils in woods, but still can cause skin irritation at higher concentrations; texanol – a solvent used in paints. In the lower ventilation (2nd) sample the same chemicals were observed, but at higher concentrations.
This experiment demonstrates the importance in the use of purpose-provided ventilation. Without ventilation, and within an airtight property, the concentration levels of pollutants inside seem set to rise – who knows how high these concentrations would have risen to if the experiment continued for longer than 7 days.
More IAQ stuff to come.